Topic 2. Visual Data Analysis#
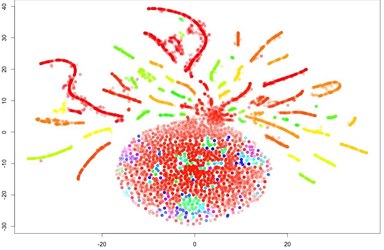
The role of visual data analysis is hard to overestimate, this is how new insights are found in data and how features are engineered. Here we discuss main data visualization techniques and how they are applied in practice. Also take a sneak peek into multidimensional feature space using the t-SNE algorithm, which sometimes is useful but mostly just draws such Christmas tree decorations as shown above.
Steps in this block#
Read two articles: “Visual data analysis in Python” (same as a Kaggle Notebook) and “Overview of Seaborn, Matplotlib and Plotly libraries” (same as a Kaggle Notebook);
Watch a video lecture “Visualization” (optional);
Complete demo assignment 2 (same as a ) where you’ll be analyzing cardiovascular disease data;
Check out the solution (same as a Kaggle Notebook) to the demo assignment (optional);
Complete Bonus Assignment 2 where you’ll be performing EDA of a much larger dataset of US flights sometimes attending to the performance of basic operations (optional, available under Patreon “Bonus Assignments” tier).